
Description
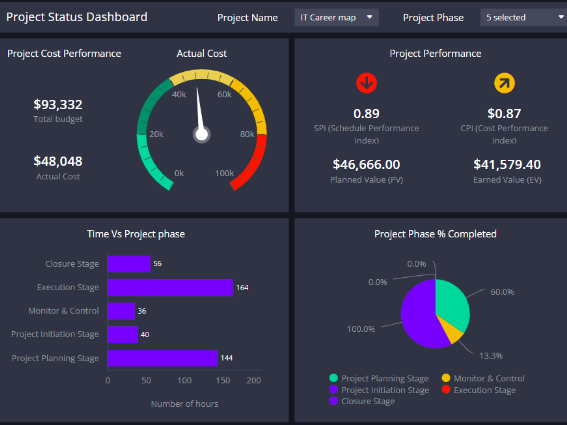
Business Intelligence (BI) dashboards are dynamic, visual tools that provide real-time insights into business performance by transforming raw data into interactive charts, graphs, and tables. Designed to support data-driven decision-making, BI dashboards offer stakeholders—from executives to frontline staff—a clear, concise view of key performance indicators (KPIs), metrics, and trends across various departments and functions.
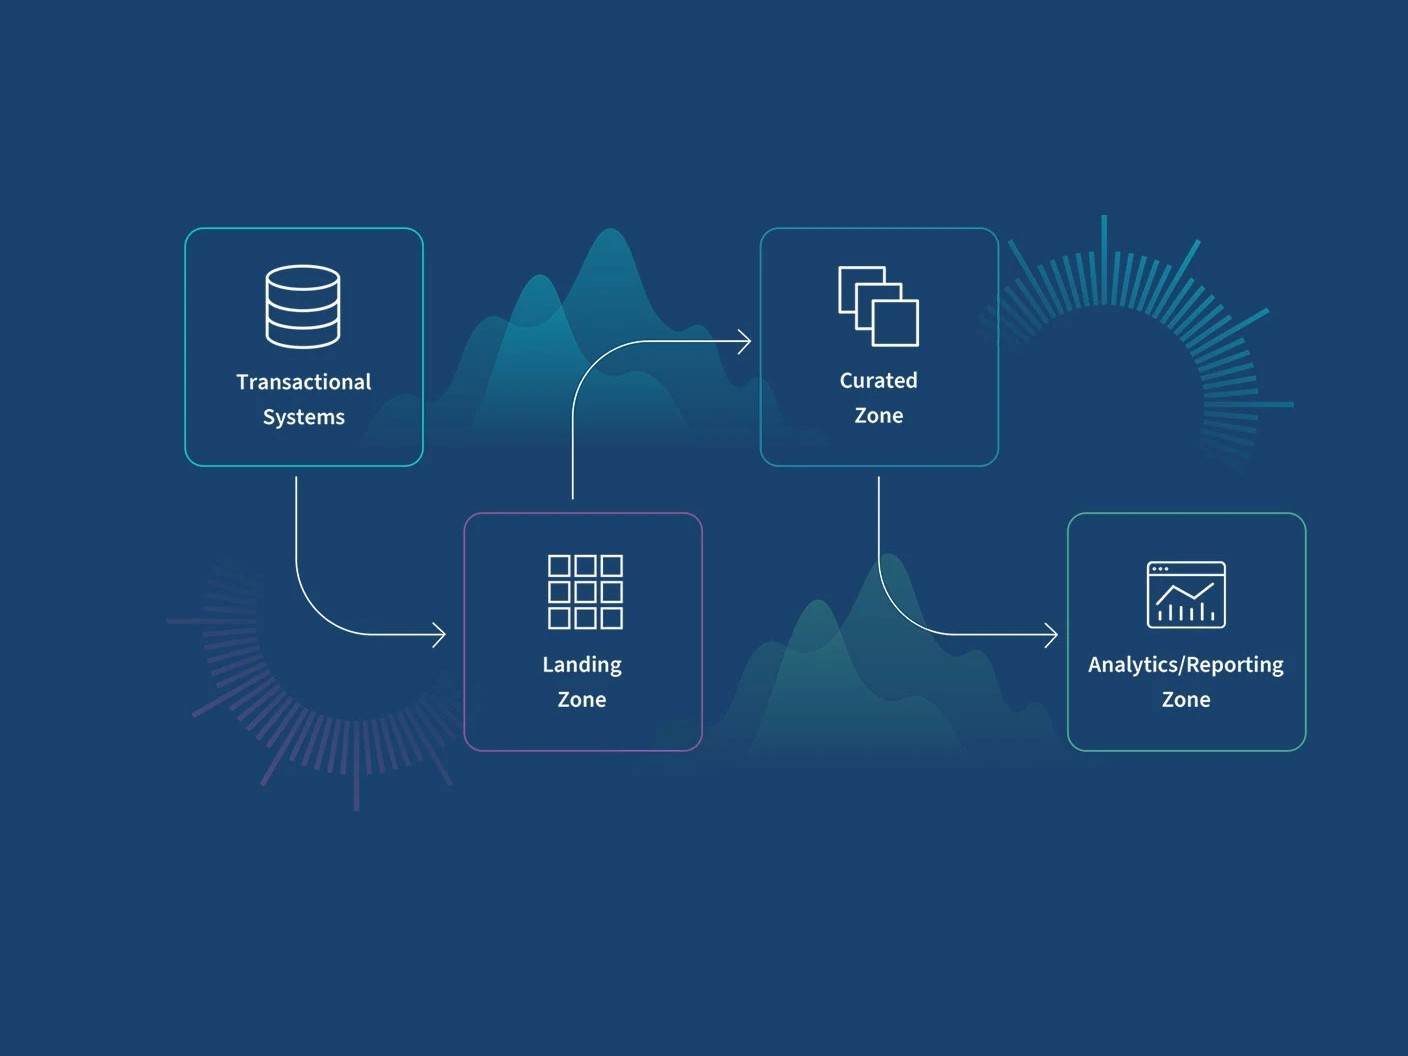
These dashboards are typically customizable and connect to multiple data sources including databases, cloud applications, CRM systems, ERP platforms, spreadsheets, and more. Users can filter, drill down, or explore datasets in a way that helps them understand what’s working, what’s not, and where improvements are needed. Whether tracking sales trends, monitoring financial metrics, analyzing website traffic, or overseeing operational efficiency, BI dashboards help businesses stay proactive and agile.
Advanced BI dashboards go beyond simple visualization by incorporating artificial intelligence (AI) and machine learning (ML) algorithms to detect anomalies, predict future outcomes, and recommend actions. Many dashboards now include natural language query capabilities, allowing users to ask questions and receive visual responses without writing any code.
BI dashboards also promote organizational alignment by making data accessible to all relevant team members, reducing information silos, and encouraging accountability. With mobile-friendly interfaces, cloud access, and role-based permissions, stakeholders can make informed decisions anytime, anywhere.
In today’s data-saturated business environment, BI dashboards are indispensable for turning complex datasets into meaningful insights that support real-time decisions, strategic planning, and sustained growth.


Khadija –
Our leadership team now has a bird’s-eye view of performance metrics in real time. It’s helped align business goals and streamline quarterly reviews.
Affiong –
The BI dashboards turned our raw data into clear, actionable insights. Now, department heads can make faster, data-driven decisions without waiting on monthly reports.
Musa –
We were amazed by how intuitive the dashboards are. Our non-technical staff uses them confidently to track performance, which boosts team accountability.
Isreal –
Gone are the days of making decisions based on outdated spreadsheets. These dashboards give us real-time data, which has significantly improved our agility.
Yemi –
What I love most is the flexibility. Marketing, sales, and finance each have personalized dashboards tailored to their KPIs—no more one-size-fits-all reporting.